
Unit 3 Statistics
CIMT Textbook
Textbook: Chapter 17 Chapter 18
Video tutorials
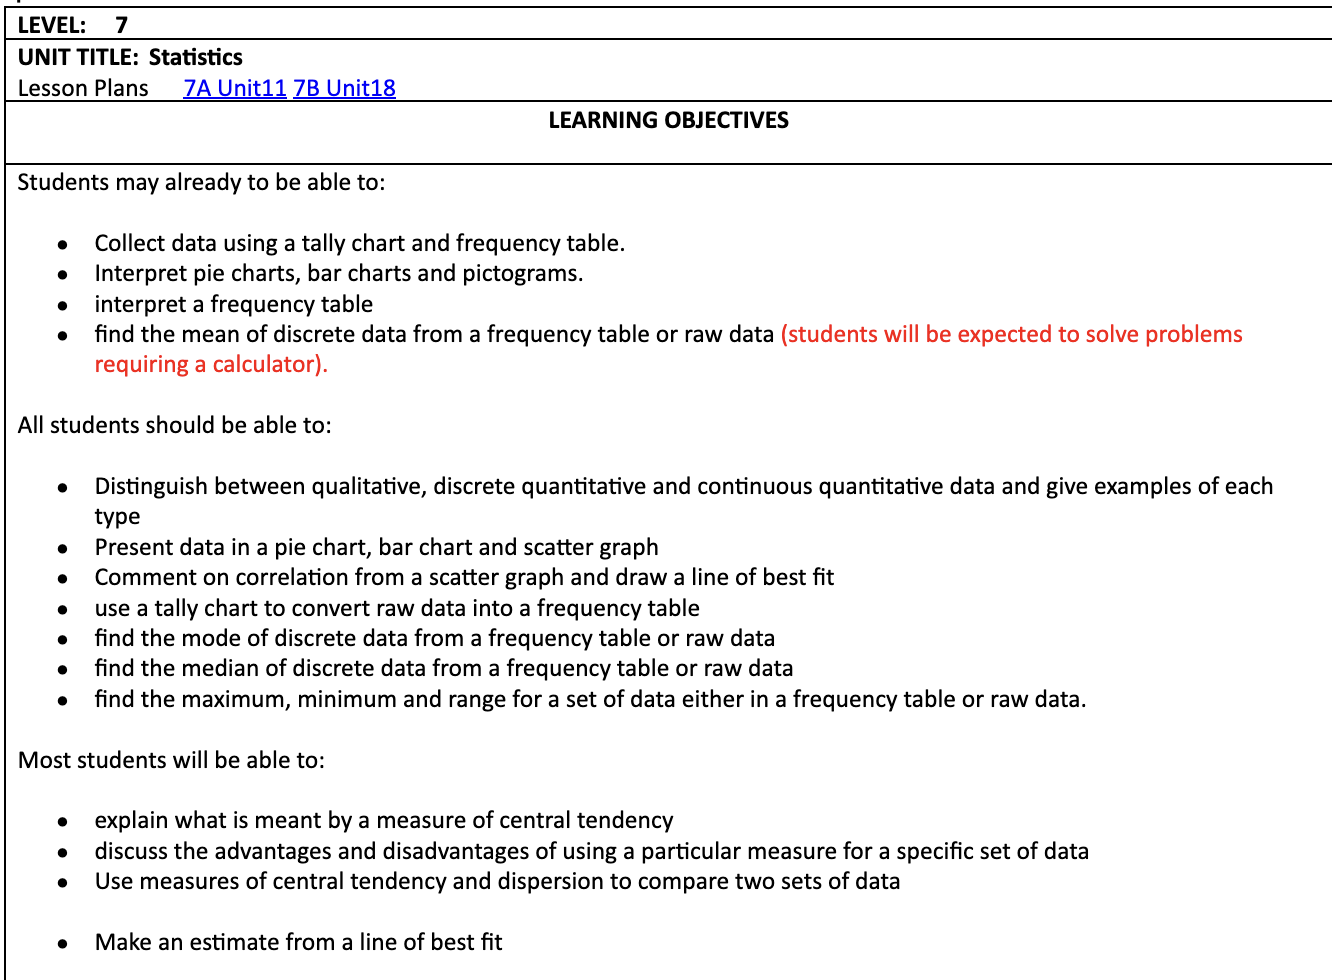
Collect data using a tally chart and frequency table.
Interpret pie charts, bar charts and pictograms.
Interpret a frequency table.
Distinguish between qualitative, discrete quantitative and continuous quantitative and data and give examples of each type.
Find the mode, median range and mean of discrete data from a frequency table or raw data.
Explain what is meant by a measure of central tendency and discuss the advantages and disadvantages of using a particular measure for a specific set of data.
Use measures of central tendency and dispersion to compare two sets of data.
Scatter graphs
Links to Interactive CIMT resources
http://www.cimt.org.uk/projects/mepres/book7/bk7i11/bk7_11i1.htm
http://www.cimt.org.uk/projects/mepres/book7/bk7i11/bk7_11i2.htm
http://www.cimt.org.uk/projects/mepres/book7/bk7i18/bk7_18i1.htm
http://www.cimt.org.uk/projects/mepres/book7/bk7i18/bk7_18i2.htm
http://www.cimt.org.uk/projects/mepres/book7/bk7i18/bk7_18i3.htm
http://www.cimt.org.uk/projects/mepres/book7/bk7i18/bk7_18i4.htm
http://www.cimt.org.uk/projects/mepres/book7/bk7i18/bk7_18i5.htm

You must be logged in to post a comment.